The AOL disks used in the study were obtained by randomly grabbing fifty disks from a box of unopened AOL disks in the media center. The Imation floppies were obtained by purchasing two boxes of twenty-five each from a local computer store. There were fifty disks of each type, for a total of one-hundred disks. The population of interest is all AOL disks and all Imation disks.
Data:
|
|
|
|
|
|
|
|
|
|
|
|
|
|
|
|
|
|
|
|
|
|
|
Significance Tests:
Chi-Square test:
Ho:
the proportion of bad disks is independent of the manufacturer
Ha:
the proportion of bad disks is not independent of the manufacturer
assume
that the proportion of bad disks of each type will be equal, so pi = .5
![]()
each
expected = .5 * 1
|
|
|
|
|
|
|
|
|
|
|
|
95% Confidence interval:
![]()
0-1
+- 1.96*sqrt(0(1-0)/50 + .02(1-.02)/50)
(-1.0388,
-.9612)
95%
of all samples will have differences of proportions which will fall within
this range.
Z test:
P1(AOL)
= 0
P2(Imation)
= .02
![]()
Pc
= .01
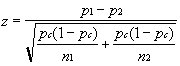
z
= -1.005
P-value
= .1587
Ho:
No difference between AOL and Imation disks
Ha:
There is a difference between AOL and Imation disks
Since
P-value is greater than any reasonable alpha, there is no
difference
between AOL and Imation disks.