Graphs
| Sample | N | Mean | StDev | SE Mean |
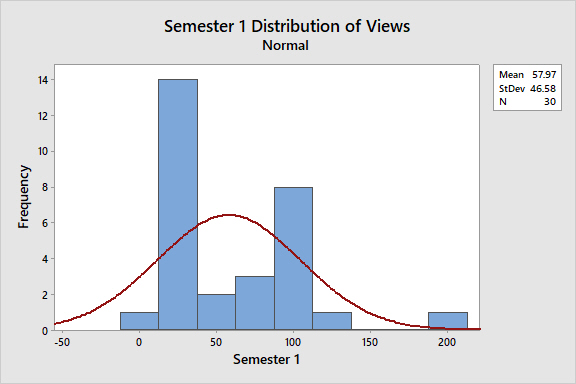
| Semester 1 | 30 | 58.0 | 46.6 | 8.5 |
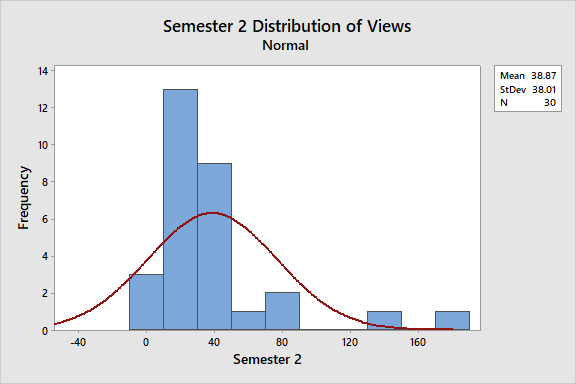
| Semester 2 | 30 | 38.9 | 38.0 | 6.9 |
The histogram for semester 1 shows that the data has a
greater range, greater mean, and greater standard
deviation than the semester 2 sample. The descriptive
statistics support this, as the average number of views
for semester 1 videos is 9.1 views greater than for
semester 2, and the standard deviation for semester 1 is
8.6
greater than semester 2. Both distributions
are right
skewed, as only a few videos tend to have a
large number
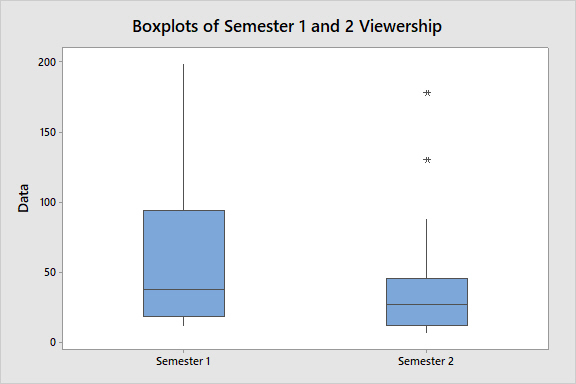
of views. The box plot supports this as
well, as
semester 1 has a greater interquartile range
(IQR) than
semester 2. Despite the graphs seeming to
imply that for
some reason, semester 1 has more
variability in
viewership than semester 2, the semester
2 sample
actually has two outliers on the right end,
including an
extreme outlier (as the video is more than
3 IQRS from
the third quartile).