Math Portal
Introductory Statistics
Section 1.2 - Stem-and-Leaf
Plots
A stem-and-leaf plot is a visual display of data in which each data value is separated into two parts: a stem and a leaf. For a given data value, the leaf is usually the last digit, and the stem is the remaining digits. For example, for the data value 238, 23 is the stem and 8 is the leaf. When you create a stem-and-leaf plot, you should include a legend that explains what is represented by the stem and leaf so that the reader can interpret the information in the plot; for example, 23|8 = 238. Note that a feature of a stem-and-leaf plot is that the original data are retained and displayed in the plot. Here are typical attributes of a stem-and-leaf plot:
A stem-and-leaf plot is a visual display of data in which each data value is separated into two parts: a stem and a leaf. For a given data value, the leaf is usually the last digit, and the stem is the remaining digits. For example, for the data value 238, 23 is the stem and 8 is the leaf. When you create a stem-and-leaf plot, you should include a legend that explains what is represented by the stem and leaf so that the reader can interpret the information in the plot; for example, 23|8 = 238. Note that a feature of a stem-and-leaf plot is that the original data are retained and displayed in the plot. Here are typical attributes of a stem-and-leaf plot:
- The data are recorded in two columns. The column on the left is labeled Stem and the column on the right is labeled Leaves.
- The stems are listed vertically, from smallest to largest, in the column labeled Stem.
- The leaves are listed horizontally under the column labeled Leaves. Each leaf is listed to the right of its corresponding stem and as many times as it occurs in the original data set. Usually, the leaves are listed from smallest to largest in the row of their corresponding stem.
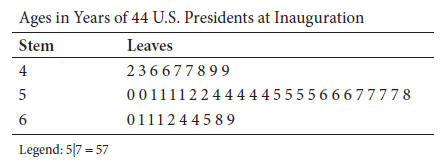
- The plot has a legend to guide the reader in interpreting the information displayed.
- The youngest age at which a President was inaugurated was 42.
- The oldest age at which a President was inaugurated was 69.
- More Presidents were inaugurated in their 50s.
- There were 6 Presidents that were older than 61 at the time of their inauguration.