Math Portal
Introductory Statistics
Section 1.5 - Variance and Standard Deviation
What is Variability?
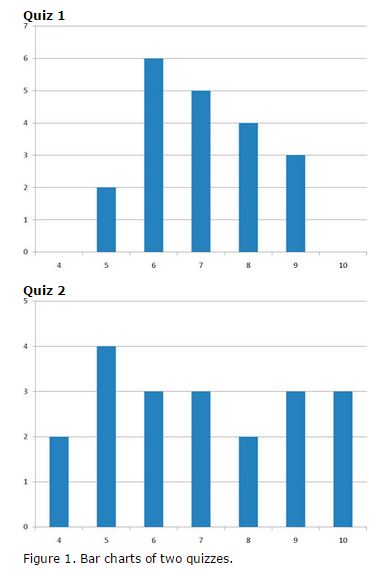
Variability refers to how "spread out" a group of scores is. To see what we mean by spread out, consider the graphs in Figure 1. These graphs represent the scores on two quizzes. The mean score for each quiz is 7.0. Despite the equality of means, you can see that the distributions are quite different. Specifically, the scores on Quiz 1 are more densely packed and those on Quiz 2 are more spread out. The differences among students were much greater on Quiz 2 than on Quiz 1.
Variance
Variance can defined in terms of how close the scores in the distribution or data set are to the middle of the distribution. Using the mean as the measure of the middle of the distribution, the variance is defined as the average squared difference of the scores from the mean. If there is no variability in a data set (in other words the variance is equal to zero), then each data value equals the mean.
The symbol for the population variance is σ2 (sigma squared) and the symbol for sample variance is s2 (s squared). While there are some rather interesting formulas for these we are going to use a basic online statistical calculator to figure these out.
Standard Deviation
The standard deviation is simply the square root of the variance. The standard deviation is an especially useful measure of variability when the distribution is normal or approximately normal because the proportion of the distribution within a given number of standard deviations from the mean can be calculated.
For example, 68% of the distribution is within one standard deviation of the mean and approximately 95% of the distribution is within two standard deviations of the mean. Therefore, if you had a normal distribution with a mean of 50 and a standard deviation of 10, then 68% of your data would be between 40 and 60 units. 95% of your data would fall between 30 and 70 units.
The symbol for the population variance is σ (sigma) and the symbol for sample variance is s. Again we are going to use a basic online statistical calculator to calculate out standard deviation.
Summary
The key concept to take from this is that if you have a small variance or a small standard deviation, then your data is close to your center or mean. The further your data is away from the mean, the larger the variance and standard deviation will be.
Population vs. Sample
We are normally interested in knowing the standard deviation or variance of the population because our population contains all the values we are interested in. Therefore, you would normally calculate the population variance or standard deviation if you have data for the entire population. If you are going to use your data to make predications or inferences to a larger group than you would calculate the sample variance or standard deviation. Depending on the circumstances a set of data could be classified as both a sample as well as a population.
EXAMPLE: A classroom teacher might use a Geometry class as a population if she is only concerned about the classroom as a single entity. She could also use it as a sample if she wanted to take that data and use it to make inferences about all Geometry classes in a particular school.
Here are a few examples to help clarify when to calculate using sample or population.
EXAMPLE: A teacher sets an exam for her students. She wants to calculate out some measures of central tendency for her class. Should she view her class as a sample or as a population?
ANSWER: Population standard deviation. Because the teacher is only interested in this class of pupils' scores and nobody else.
EXAMPLE: A researcher has recruited males aged 45 to 65 years old for an exercise training study to investigate risk markers for heart disease (e.g., cholesterol). Which standard deviation would most likely be used?
ANSWER: Sample standard deviation. Although not explicitly stated, a researcher investigating health related issues will not simply be concerned with just the participants of their study; they will want to show how their sample results can be generalized to the whole population.
EXAMPLE: One of the questions on a national consensus survey asks for respondents' age. Which standard deviation would be used to describe the variation in all ages received from the consensus?
ANSWER: Population standard deviation. A national consensus is used to find out information about all of the nation's citizens. By definition, it includes the whole population. Therefore, a population standard deviation would be used.
What is Variability?
Variability refers to how "spread out" a group of scores is. To see what we mean by spread out, consider the graphs in Figure 1. These graphs represent the scores on two quizzes. The mean score for each quiz is 7.0. Despite the equality of means, you can see that the distributions are quite different. Specifically, the scores on Quiz 1 are more densely packed and those on Quiz 2 are more spread out. The differences among students were much greater on Quiz 2 than on Quiz 1.
Variance
Variance can defined in terms of how close the scores in the distribution or data set are to the middle of the distribution. Using the mean as the measure of the middle of the distribution, the variance is defined as the average squared difference of the scores from the mean. If there is no variability in a data set (in other words the variance is equal to zero), then each data value equals the mean.
The symbol for the population variance is σ2 (sigma squared) and the symbol for sample variance is s2 (s squared). While there are some rather interesting formulas for these we are going to use a basic online statistical calculator to figure these out.
Standard Deviation
The standard deviation is simply the square root of the variance. The standard deviation is an especially useful measure of variability when the distribution is normal or approximately normal because the proportion of the distribution within a given number of standard deviations from the mean can be calculated.
For example, 68% of the distribution is within one standard deviation of the mean and approximately 95% of the distribution is within two standard deviations of the mean. Therefore, if you had a normal distribution with a mean of 50 and a standard deviation of 10, then 68% of your data would be between 40 and 60 units. 95% of your data would fall between 30 and 70 units.
The symbol for the population variance is σ (sigma) and the symbol for sample variance is s. Again we are going to use a basic online statistical calculator to calculate out standard deviation.
Summary
The key concept to take from this is that if you have a small variance or a small standard deviation, then your data is close to your center or mean. The further your data is away from the mean, the larger the variance and standard deviation will be.
Population vs. Sample
We are normally interested in knowing the standard deviation or variance of the population because our population contains all the values we are interested in. Therefore, you would normally calculate the population variance or standard deviation if you have data for the entire population. If you are going to use your data to make predications or inferences to a larger group than you would calculate the sample variance or standard deviation. Depending on the circumstances a set of data could be classified as both a sample as well as a population.
EXAMPLE: A classroom teacher might use a Geometry class as a population if she is only concerned about the classroom as a single entity. She could also use it as a sample if she wanted to take that data and use it to make inferences about all Geometry classes in a particular school.
Here are a few examples to help clarify when to calculate using sample or population.
EXAMPLE: A teacher sets an exam for her students. She wants to calculate out some measures of central tendency for her class. Should she view her class as a sample or as a population?
ANSWER: Population standard deviation. Because the teacher is only interested in this class of pupils' scores and nobody else.
EXAMPLE: A researcher has recruited males aged 45 to 65 years old for an exercise training study to investigate risk markers for heart disease (e.g., cholesterol). Which standard deviation would most likely be used?
ANSWER: Sample standard deviation. Although not explicitly stated, a researcher investigating health related issues will not simply be concerned with just the participants of their study; they will want to show how their sample results can be generalized to the whole population.
EXAMPLE: One of the questions on a national consensus survey asks for respondents' age. Which standard deviation would be used to describe the variation in all ages received from the consensus?
ANSWER: Population standard deviation. A national consensus is used to find out information about all of the nation's citizens. By definition, it includes the whole population. Therefore, a population standard deviation would be used.