Math Portal
Introductory Statistics
Section 1.6 - Interquartile Range and the 5-Number Summary
The interquartile range is another measure of the spread of a data set. To compute the interquartile range, you first compute the first and third quartiles of the data set. Quartiles are values that divide an ordered data set into four equal parts that each contain approximately one-fourth of the data values. Twenty-five percent of the data values fall at or below the first quartile (Q1), 50 percent of the data values fall at or below the second quartile (Q2) (which is the same value as the median), and 75 percent of the data values fall at or below the third quartile (Q3).
The interquartile range (IQR) is the difference between the first and third quartiles; that is,
IQR = Q3-Q1.
The IQR contains the center 50 percent of the data. It gives you an indication of how much the data values stretch from the center of the data.
Five-Number Summary
Sometimes it’s difficult to make sense of large data sets. One helpful way to make it easier is to “summarize” it using the five-number summary. For a data set, the five-number summary is a set of five measures:
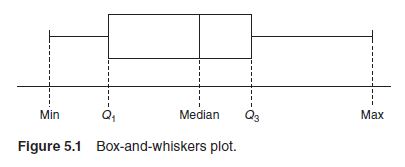
You can graphically represent the five-number summary for a data set using a box-and whiskers plot as shown in Figure 5.1.
The interquartile range is another measure of the spread of a data set. To compute the interquartile range, you first compute the first and third quartiles of the data set. Quartiles are values that divide an ordered data set into four equal parts that each contain approximately one-fourth of the data values. Twenty-five percent of the data values fall at or below the first quartile (Q1), 50 percent of the data values fall at or below the second quartile (Q2) (which is the same value as the median), and 75 percent of the data values fall at or below the third quartile (Q3).
The interquartile range (IQR) is the difference between the first and third quartiles; that is,
IQR = Q3-Q1.
The IQR contains the center 50 percent of the data. It gives you an indication of how much the data values stretch from the center of the data.
Five-Number Summary
Sometimes it’s difficult to make sense of large data sets. One helpful way to make it easier is to “summarize” it using the five-number summary. For a data set, the five-number summary is a set of five measures:
- The minimum data value, Min
- The first quartile, Q1
- The median of the data set, Med
- The third quartile, Q3
- The maximum data value, Max
You can graphically represent the five-number summary for a data set using a box-and whiskers plot as shown in Figure 5.1.