Math Portal
Introductory Statistics
Section 4.4 - Correlations and Their Coefficients
Pearson's Correlation Coefficient
The Pearson correlation coefficient is a measure of the strength of the linear relationship between two variables. It is often referred to as Pearson's correlation or simply as the correlation coefficient. If the relationship between the variables is not linear, then the correlation coefficient does not adequately represent the strength of the relationship between the variables. The formula for calculating this value is somewhat complicated, so we'll let the computer do this for us.
The symbol for Pearson's correlation is ρ when it is measured in the population and r when it is measured in a sample. Because we will be dealing almost exclusively with samples, we will use r to represent Pearson's correlation unless otherwise noted.
5 Properties of Pearson's r
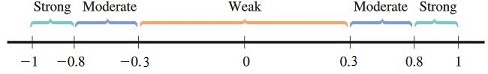
| 1 | Pearson's r can range from -1 to 1. |
| |
| Figure 1. These ranges help us define which values for Pearson's Correlation Coefficient indicate a weak, moderate, or strong linear relationship. | |
| 2. | An r of 0 indicates no linear relationship between variables. There may be no pattern at all or there may be a curved pattern. |
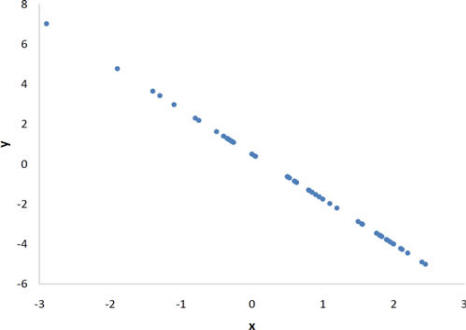
| 3. | An r of -1 indicates a perfect negative linear relationship between variables and an r of 1 indicates a perfect positive linear relationship between variables. |
 |
|
| Figure 2. A perfect positive linear relationship, r = 1. | |
 |
|
| Figure 3. A perfect negative linear relationship, r = -1. | |
| 4. | The value of Pearson's Correlation Coefficient does not depend on which variable we consider the dependent or independent variable. Since it's a measure of the relationship between the two variables, we can exchange the axes without changing the value of r. |
| 5. | The value of Pearson's Correlation Coefficient does not depend on the unit of measure for either variable. You can change a measure from feet to miles on an axis and convert all the data from feet to miles and the relationship of that variable to the other variable will remain the same. You can also multiply by some given value and/or add some constant amount to a variable without changing its correlation to another variable! |
| 6. | R2 is called the Coefficient of Determination and is used to determine how well the data fits the statistical model. In a regression, the R2 coefficient can tell us how well the regression line approximates the real data points. An R2 of 1 indicates that the regression line perfectly fits the data. |
| For example, if r = 0.922, then r2 = 0.850, which means that 85% of the total variation in y can be explained by the linear relationship between x and y (as described by the regression equation). The other 15% of the total variation in y remains unexplained. | |