Math Portal
Introductory Statistics
Section 5.4 - The Normal Distribution
The most prevalent and, by far, the most important continuous distribution is the normal (probability) distribution or normal curve. The normal distribution is so prevalent because it can be used as a model for the distributions of many naturally occurring phenomena, such as heights, weights, IQs, and so on. This distribution and its characteristics are introduced in this chapter.
Properties of a Normal Distribution
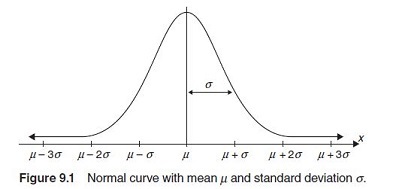
A random variable X is said to be normally distributed with mean μ and standard deviation σ if the graph of its probability distribution, called its density curve, is a bell-shaped curve.
The density curve must satisfy the following two properties:
1. The total area under the curve, bounded by the horizontal axis, is 1.
2. Every point on the curve must have a vertical height greater than or equal to 0.
The normal curve or normal distribution is the name given to the family of distributions of normal random variables. Normal distributions have the following properties in common:
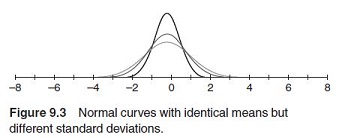
The standard deviation is a measure of the variability (or spread) of the distribution. You can think of σ as a shape parameter because it determines whether the distribution is tall and thin (corresponding to small values of σ ) or short and wide (corresponding to large values of σ). Figure 9.3 shows three normal curves with identical means but different standard deviations.
The bell shape of the curve means that most of the data will fall in the middle of the distribution, with the amount of data tapering off evenly in both directions as you move away from the center of the distribution. This characteristic of normal distributions can be expressed in a more accurate way, which (for convenience) you can call the 68 -95-99.7 Property, as follows: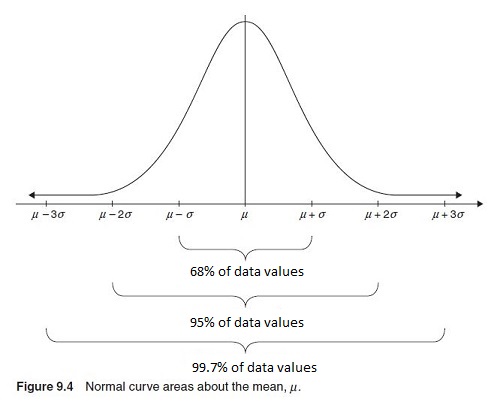
This means that most (99.74%) of all data in a normal distribution will fall within 3 standard deviations of the mean. Only 0.26% (less than 1%) of all data will be outside those values.
PROBLEM: Express the 68-95-99.7 Property in terms of a normal random variable with a mean μ = 100 and standard deviation σ = 15.
SOLUTION: 68% of the data lies within 1 standard deviation of the mean. This means that 68% of the data will lie between 85 and 115.
95% of the data will fall between 2 standard deviations or between 70 and 130.
99.7% of the data will fall between 3 standard deviations or between 55 and 145.
PROBLEM: The normal random variable X has mean μ = 200 and standard deviation σ = 10. Find the probability that X assumes a value within two standard deviations of μ = 200.
SOLUTION: Since μ = 200 is the mean, the probability that X assumes a value within two standard deviations of its mean equals P(180 < X < 220) = .95 or 95%
PROBLEM: The normal random variable X has mean μ = 150 and standard deviation σ = 7. Find P(143 < X < 157).
SOLUTION: Since the mean is 150 and 143 is one standard deviation down from the mean and 157 is one standard deviation up from the mean, the probability is .68 or 68%.
PROBLEM: Find the indicated probability for the normal random variable X with mean μ = 9 and standard deviation σ = 4.
a. P(5 < X < 13).
b. P(1 < X < 17).
c. P(-3 < X < 21).
SOLUTION:
a. This is one standard deviation up and down from the mean, so the probability = .68
b. This is two standard deviations up and down from the mean, so the probability = .95
c. This is three standard deviations up and down from the mean, so the probability = .997
The most prevalent and, by far, the most important continuous distribution is the normal (probability) distribution or normal curve. The normal distribution is so prevalent because it can be used as a model for the distributions of many naturally occurring phenomena, such as heights, weights, IQs, and so on. This distribution and its characteristics are introduced in this chapter.
Properties of a Normal Distribution
A random variable X is said to be normally distributed with mean μ and standard deviation σ if the graph of its probability distribution, called its density curve, is a bell-shaped curve.
The density curve must satisfy the following two properties:
1. The total area under the curve, bounded by the horizontal axis, is 1.
2. Every point on the curve must have a vertical height greater than or equal to 0.
The normal curve or normal distribution is the name given to the family of distributions of normal random variables. Normal distributions have the following properties in common:
- The distribution is completely defined by two parameters: its mean μ and standard deviation σ.
- The distribution is bell-shaped and symmetric about its mean μ.
- The standard deviation σ is the distance from a vertical line at μ to where the curvature of the graph changes on either side.
- The distribution is continuous, extending from -∞ to ∞.
- The x-axis is a horizontal asymptote for the curve (meaning the graph never touches the x-axis).
- The total area bounded by the curve and the horizontal axis is 1, with 0.5 area to the left of μ and 0.5 area to the right of μ.
- The mean, median, and mode coincide (meaning they are all the same value).
The standard deviation is a measure of the variability (or spread) of the distribution. You can think of σ as a shape parameter because it determines whether the distribution is tall and thin (corresponding to small values of σ ) or short and wide (corresponding to large values of σ). Figure 9.3 shows three normal curves with identical means but different standard deviations.
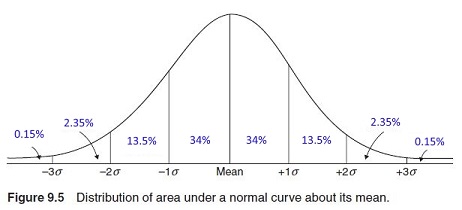
The bell shape of the curve means that most of the data will fall in the middle of the distribution, with the amount of data tapering off evenly in both directions as you move away from the center of the distribution. This characteristic of normal distributions can be expressed in a more accurate way, which (for convenience) you can call the 68 -95-99.7 Property, as follows:
- About 68 percent of the values of a random variable that is normally distributed fall within one standard deviation of the mean
- About 95 percent fall within two standard deviations of the mean
- About 99.7 percent fall within three standard deviations of the mean
This means that most (99.74%) of all data in a normal distribution will fall within 3 standard deviations of the mean. Only 0.26% (less than 1%) of all data will be outside those values.
PROBLEM: Express the 68-95-99.7 Property in terms of a normal random variable with a mean μ = 100 and standard deviation σ = 15.
SOLUTION: 68% of the data lies within 1 standard deviation of the mean. This means that 68% of the data will lie between 85 and 115.
95% of the data will fall between 2 standard deviations or between 70 and 130.
99.7% of the data will fall between 3 standard deviations or between 55 and 145.
PROBLEM: The normal random variable X has mean μ = 200 and standard deviation σ = 10. Find the probability that X assumes a value within two standard deviations of μ = 200.
SOLUTION: Since μ = 200 is the mean, the probability that X assumes a value within two standard deviations of its mean equals P(180 < X < 220) = .95 or 95%
PROBLEM: The normal random variable X has mean μ = 150 and standard deviation σ = 7. Find P(143 < X < 157).
SOLUTION: Since the mean is 150 and 143 is one standard deviation down from the mean and 157 is one standard deviation up from the mean, the probability is .68 or 68%.
PROBLEM: Find the indicated probability for the normal random variable X with mean μ = 9 and standard deviation σ = 4.
a. P(5 < X < 13).
b. P(1 < X < 17).
c. P(-3 < X < 21).
SOLUTION:
a. This is one standard deviation up and down from the mean, so the probability = .68
b. This is two standard deviations up and down from the mean, so the probability = .95
c. This is three standard deviations up and down from the mean, so the probability = .997