Math Portal
Introductory Statistics
Section 6.2 - Z-Scores
A Z-score or a standard score indicates how many standard deviations an element is from the mean. A z-score can be calculated from the following formula:
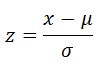
where z is the z-score, X is the value of the element, μ is the population mean, and σ is the standard deviation.
Example: Jane took a test and scored an 80% on the test. The teacher indicates that the mean (μ) was 70% with a standard deviation (σ) of 8. If we calculate the z-score (80-70)/8 = 1.25. We can see that Jane scored 1.25 standard deviations above the mean. By using a Z-Table we can cross reference this score by looking at 1.2 on the left side and crossing over to the 0.05 on the top. We can see that Jane scored .8944. In other words she scored better than 89.44% of the rest of her class.
Example: Alan opened a pack of M&Ms and counted the total number of candies and came up with 53 M&Ms. He found that the average number of candies in a bag was 56.6 with a standard deviation (σ) of 1.99. We can calculate the z-score (53-56.6)/1.99 = -1.81. According to the chart the probability that his bag contained that many M&M candies was 0.0351 or 3.51%.
A Z-score or a standard score indicates how many standard deviations an element is from the mean. A z-score can be calculated from the following formula:
where z is the z-score, X is the value of the element, μ is the population mean, and σ is the standard deviation.
Example: Jane took a test and scored an 80% on the test. The teacher indicates that the mean (μ) was 70% with a standard deviation (σ) of 8. If we calculate the z-score (80-70)/8 = 1.25. We can see that Jane scored 1.25 standard deviations above the mean. By using a Z-Table we can cross reference this score by looking at 1.2 on the left side and crossing over to the 0.05 on the top. We can see that Jane scored .8944. In other words she scored better than 89.44% of the rest of her class.
Example: Alan opened a pack of M&Ms and counted the total number of candies and came up with 53 M&Ms. He found that the average number of candies in a bag was 56.6 with a standard deviation (σ) of 1.99. We can calculate the z-score (53-56.6)/1.99 = -1.81. According to the chart the probability that his bag contained that many M&M candies was 0.0351 or 3.51%.