TICK_TOCK
A Study of Tardiness
the Study
Sampling
In order to get our data, we obtained the 3rd quarter attendance lists from Mrs. Caso. This lists the names and grades of all those who were tardy or absent for the 39 days that made up 3rd quarter. Because these lists have the names of all those who were tardy from all of North Olmsted High School, our study is considered a census; therefore, there is no sample size. Our population of interest is all the students at North Olmsted High School.
| Day | observed | expected | observed* | expected* | |
| Monday | 264 | 291.6 | 264 | 291.6 | |
| Tuesday | 271 | 291.6 | 347 | 291.6 | |
| Wednesday | 286 | 291.6 | 286 | 291.6 | |
| Thursday | 287 | 291.6 | 287 | 291.6 | |
| Friday | 274 | 291.6 | 274 | 291.6 | |
| 1458 | 1458 |
(*with outliers)
Descriptive Statistics: observed
Variable N Mean Median TrMean StDev SE Mean
observed 5 276.40 274.00 276.40 9.91 4.43
Variable Minimum Maximum Q1 Q3
observed 264.00 287.00 267.50 286.50
Descriptive Statistics: observed*
Variable N Mean Median TrMean StDev SE Mean
observed 5 291.6 286.0 291.6 32.4 14.5
Variable Minimum Maximum Q1 Q3
observed 264.0 347.0 269.0 317.0
(*with outliers)
With Outliers
Ho: The proportions of NOHS students arriving tardy for each day of the week is the same.
Ha: The proportions of NOHS students arriving tardy for each day of the week is not the same.
alpha=.05
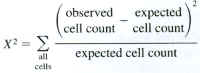
(264-291.6)² + (347 – 291.6) ² + (286 – 291.6) ² + (247 – 291.6) ² + (274 – 291.6)² 291.6 291.6 291.6 291.6 291.6
21.1289= x²
Df= 4
P <0.0005
We can reject the null hypothesis at any reasonable level of significance because our p value is less than .0005. Therefore there is significant evidence to conclude that the proportions of NOHS students arriving tardy for each day differs from day to day.
Without Outliers
Ho: The proportions of NOHS students arriving tardy for each day of the week is the same.
Ha: The proportions of NOHS students arriving tardy for each day of the week is not the same.
alpha=.05
(264-291.6)² + (271 – 291.6) ² + (286 – 291.6) ² + (247 – 291.6) ² + (274 – 291.6)²291.6 291.6 291.6 291.6 291.6 = x²
12.0589= x²
Df= 4
P =.02< x²<.01
Since our p value is less than the .05 level of significance we reject the null hypothesis. Therefore there is significant evidence to conclude that the proportions of NOHS students arriving tardy for each day differs from day to day.