GPA vs Hair Color
Is there a difference between those with blonde hair and other colors?
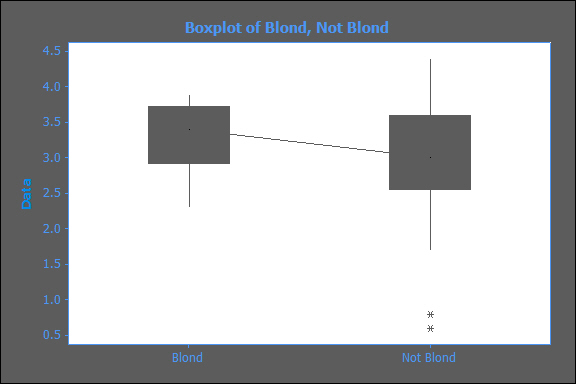
Descriptive Statistics: Blond, Not Blond
Variable N N* Mean SE Mean StDev Minimum Q1 Median Q3
Blond 10 0 3.400 0.171 0.540 2.300 2.925 3.650 3.725
Not Blond 49 0 3.014 0.118 0.829 0.600 2.550 3.200 3.600
Variable Maximum
Blond 3.900
Not Blond 4.400