

Sampling Technique
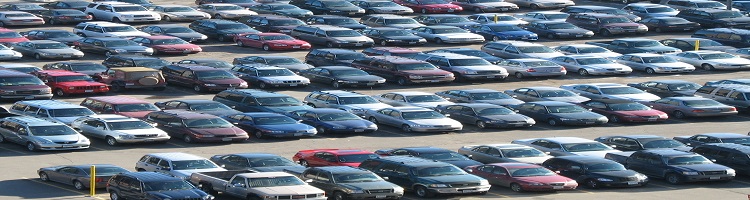
The population in question is all NOHS students who drive a car to and from school and who leave the building at around the time (2:30p.m. - 2:50p.m.). The sample of our study is randomly selected NOHS students who drive a car to and from school and who leave the building around the normal time (2:30p.m. - 2:50p.m.) Our sample size was 30 students, collected over four days.
Everett started a timer on his watch right as the end of 11th period bell rang. We then rushed outside very quickly, starting data collecting under a minute after the bell rang. We collected our data by having Robert stand at the main high school door and having Everett stand at the exit area of the main parking lot coming onto Burns Road. We were on the phone with each other and Robert said names of students leaving the building while Everett recorded the times using his watch. We did this for as many people as possible a day, until we had an excess of thirty people recorded. We then removed obvious outliers, such as a group of seniors who we saw loitering in their cars after almost everyone else had left.
Hypothesis Test
We chose to use a Two-Sample T-Test to see whether the mean time to leave the parking lot for students who drive to school and leave the building at 2:35pm - 2:40pm is greater than the mean time to leave the parking lot for students who drive to school and leave the building at either 2:30pm - 2:35pm or 2:40 - 2:45pm. These time intervals show the trends of how long it takes to leave the parking lot based upon the time of leaving the school building.
Definition of Means:(LBx Signifies mean time to leave school building for x time interval of leaving building.)
(LLx Signifies mean time to leave parking lot for x time interval of leaving building.)
Null hypothesis: The mean time to leave the parking lot for students who drive to school and leave the building at 2:35pm - 2:40pm is equal to the mean time to leave the parking lot for students who drive to school and leave the building at either 2:30pm - 2:35pm or 2:40 - 2:45pm.
Alternative hypothesis: The mean time to leave the parking lot for students who drive to school and leave the building at 2:35pm - 2:40pm is greater than the mean time to leave the parking lot for students who drive to school and leave the building at either 2:30pm - 2:35pm or 2:40 - 2:45pm.
Assumptions: We must assume that the data is representative of the population, as the data we collected, when split into categories, does not have a sample size >30. We must also assume normality, which is reasonable due to the bell shaped curve in the fitted line plot. The data was collected randomly, and we made an effort to be as unbiased as possible when selecting who to observe.
Hypothesis Test:
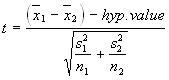
Two-sample T for ((LL5to10)-(LB5to10)) vs ((LL0to5&10to15)-(LB0to5&10to15))
N Mean StDev SE Mean
(LL5to10)-(LB5to10) 16 6.38 1.69 0.42
(LL0to5&10to15)-(LB0to5&10to15) 13 3.92 2.78 0.77
Difference = mu ((LL5to10)-(LB5to10)) - mu ((LL0to5&10to15)-(LB0to5&10to15))Estimate for difference: 2.456 95% lower bound for difference: 0.931
TT-Test of difference = 0 (vs >):
T-Value = 2.79
P-Value = 0.006 at DF = 18
Conclusion: We reject the null hypothesis at the 0.05 level of significance because the p-value is < α. Therefore, there is sufficient evidence to say that the mean time to leave the parking lot for students who drive to school and leave the building at 2:35pm - 2:40pm is greater than the mean time to leave the parking lot for students who drive to school and leave the building at either 2:30pm - 2:35pm or 2:40 - 2:45pm.